Feasibility of 100% Clean Renewable Energy Goals
The RF100 clean renewable energy goals are technically, economically, and politically feasible. Please read the information provided below to understand why.
A Representative Feasibility Study
One Earth contains Green New Deal (GND) energy roadmaps for 143 nations that in the aggregate are responsible for 99.7% of the world’s carbon emissions. The roadmaps were developed by:
- Projecting 2016 Business as Usual (BAU) energy use in multiple energy consuming sectors to 2050,
- Electrifying these energy loads, then
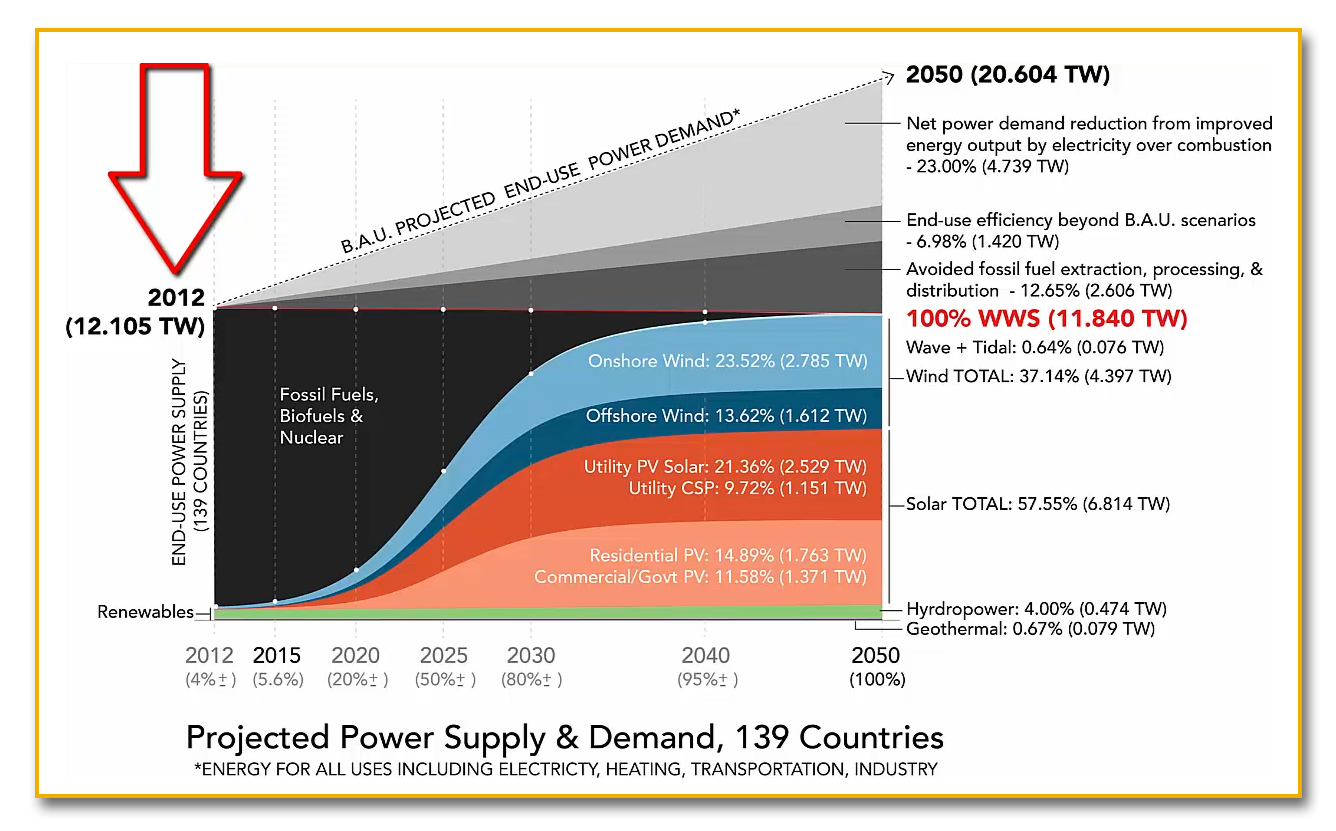
- Determining the least-cost feasible and reliable means of meeting this energy demand solely by Wind, Water, and Solar energy generated electricity, energy efficiency measures, and energy storage systems [collectively referred to as WWS].
Worldwide, WWS reduces energy needs by 57.1% because:
- WWS generated electricity produces more useful energy output per unit of energy input than does combustion of carbon-based fuels (for example, only about 17-20% of gasoline consumed in internal combustion cars moves the cars; by comparison 80-86% of electricity consumed by all electric cars moves the cars);
- WWS eliminates the energy needed to mine, transport, and refine carbon-based energy; and
- Under WWS end-use energy efficiency improves.
WWS reduces the annual aggregate private market cost of energy by 61%, from $17.7 to $6.8 trillion/yr largely due to the 57.1% decrease in energy usage.
WWS significantly reduces the external costs (negative health effects, environmental damage, and climate change costs not covered in private market energy prices) of energy consumption so that the total social costs (private market costs + external costs) are reduced by 91%, from $76.1 to $6.8 trillion/yr.
The net present value of the capital cost of transitioning to WWS energy worldwide is about $72.8 trillion (about $7.8 trillion for the United States), but this is a cost that pays itself off with electricity sales over the life of energy, storage, and transmission and distribution equipment.
Transitioning to WWS energy “could create about 28.6 million more long-term, full-time jobs than [those] lost” in the carbon-based energy production and consumption sectors, including
- Direct jobs for project development, onsite construction, onsite operation, and onsite maintenance of electricity generating facilities;
- Indirect revenue and supply-chain jobs including construction material and component suppliers, analysts and attorneys involved in project development, banks involved in financing projects, and equipment and component manufacturing; and
- Induced jobs, including those from increased business at restaurants, hotels, retail stores, childcare providers, etc.
The Solutions Project used these studies to create interactive maps that show 100% clean energy visions for the Earth, the United States, and each state within the United States. Download the Oklahoma Vision
Levelized Cost of Energy (LCOE) Evidence of WWS Feasibility
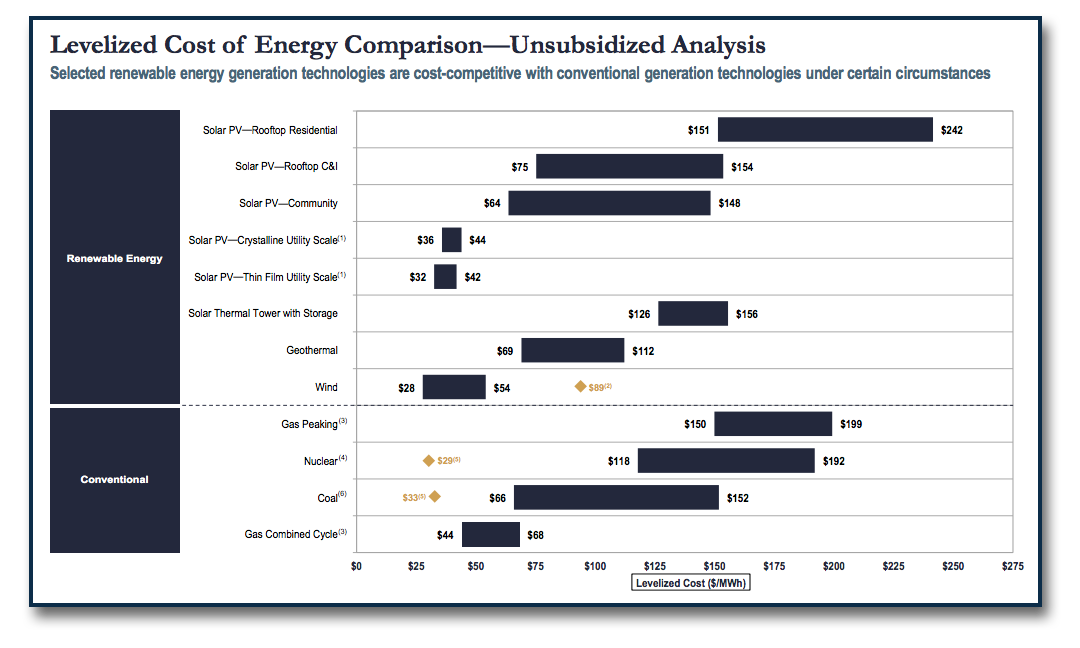
LCOE “represents the average revenue per unit of electricity generated that would be required to recover the costs of building and operating a generating plant during an assumed financial life and duty cycle. LCOE is often cited as a convenient summary measure of the overall competiveness of different generating technologies.” U.S. Energy Information Administration, Levelized Cost and Levelized Avoided Cost of New Generation Resources in the Annual Energy Outlook 2020 1 (Feb. 2020).
The following chart from Lazard’s Levelized Cost of Energy 2019 Report shows that Wind and Solar Energy has become competitive with traditional (carbon-based) sources of electricity generation.
Political Feasibility
As of July 28, 2020, 166 U.S. cities and towns had committed to achieving at least one RF100 energy goal. Norman, Oklahoma, is one of these committed cities. Download Full List
In 2011, the City of Tulsa published its City of Tulsa Sustainability Plan: Resource Efficiency, Clean Energy, and Leading Growth in the New Economy. It was Tulsa’s first (and sadly only) Sustainability Plan. Unfortunately, this plan has not been implemented. But it demonstrates that there is lurking in Tulsa the political will to bring about a clean renewable energy future. Below are highlights from this plan.
Download Full Plan
Mayor Dewey F. Bartlett’s foreword stated “to ensure future success, cities must look for energy solutions that will save money and diversify energy sources. Adding alternative energy to traditional energy will reduce operational expenses, save taxpayer dollars, and lessen our impact on air quality. It is our goal to be an example for other organizations within our city and to be a catalyst for job creation and expansion in energy industries.”
In its executive summary, the Plan said “Tulsa has the opportunity to leverage its historic position as a leading region for production, manufacturing, and services in the oil and gas industry to become a leading region in clean energy and many of the other industries that compose the Clean Tech industry cluster.” It also said that the city should explore “city ownership of the local electric utility franchise [because it] allows a city to align the policies and economic power of the local utility with local needs and opportunities, including economic development opportunities.” Plan at 2.
Most importantly, in its Economic Development Section, the Plan recognized that “an economic transformation taking place today—a transformation from an old economy that is high pollution, high carbon, waste intensive, and ecologically disruptive, to a new economy that is low pollution, energy/resource efficient, low or zero carbon and ecologically supportive. Businesses, cities, and regions that lead this economic transformation will prosper because the new economy will outperform and eventually replace the old one in the long run. Businesses, cities, and regions that lag are in danger of being left behind.” Plan at 133.
The new economy described above captures the RF100 Tulsa Campaign’s vision of Tulsa’s clean renewable energy future. Our RF100 Tulsa Campaign exists in part because we do not want Tulsa to be left behind.